Planning & Monitoring
- Target Area Selection
- RS & GIS For Base Line Data
- MIS/ GIS
- VP Micro Plan
The use of Remote Sensing and GIS technology in the Uttarakhand Forest Resources Management Project (UFRMP) for target area selection can substantially improve the precision and effectiveness of the process of carrying out spatial analysis of forest cover in close vicinity to each Van Panchayat. The system also provides unique visualization support for studying cluster formation potential. Here’s a step-by-step guide on how to approach target area selection in a forest project:
GIS Analysis Forest degradation around VP locations
Using GIS analysis to assess forest degradation around Van Panchayat (VP) locations involves utilizing spatial data to quantify and visualize changes in forest cover and quality over time. This can provide valuable insights into the state of forests and guide conservation and Eco-restoration efforts.
- Data Collection: Gather relevant spatial data, such as satellite imagery, remote sensing data, land cover maps, and forest inventory data for the VP locations and their surroundings.
Georeferencing: Ensure that all spatial data is properly georeferenced so that it aligns accurately in the GIS environment. - Defining the Target Area: Define the extent of analysis around the VP locations. This could be a buffer zone or a specific radius around each VP.
- Current Forest Cover Mapping: Use recent Forest Cover Map or remote sensing data to create a current forest cover map. This map will help and identify changes in forest cover and other land.
- Change Detection Analysis: Conduct a change detection analysis by comparing the baseline and current land cover maps. Identify areas where there has been a loss or gain of forest cover.
- Forest Degradation Indicators: Calculate and map indicators of forest degradation, such as deforestation rates, fragmentation, loss of biodiversity hotspots, and encroachment into protected areas.
- Spatial Analysis: Use GIS tools for spatial analysis, such a
- s proximity analysis to assess human encroachment, buffer analysis to determine sensitive zones, and spatial statistics to iden
 tify trends.
 - Generate Maps and Visualizations: Create maps and visualizations to present the analysis results in a comprehensible manner. Visualizing the changes can help stakeholders understand the extent of degradation.
Treatment Planning: Based on the analysis results, develop treatment plans for forest restoration, conservation, and sustainable management. Identify priority areas for interventions. - Monitoring and Evaluation Planning: Plan for ongoing monitoring and evaluation using GIS to track the effectiveness of restoration efforts and the recovery of degraded areas.
Data Collection and Pre-Field Mapping:

- Areas/ VPs selected for Treatment (name, range, etc.).
- Locations on OSM/ FSI forest cover map (1:50,000 scale).
- Collection of recent High-Resolution Satellite Images (HRSI) suitable for large scale vegetation mapping (Cartosat 2.5m b/w and Resourcesat 5.8m Liss IV).
- Provisional geo-referencing of images w.r.t OSM maps and integration with OSM map/ FSI map.
- Study of VP locations and marking / delineation of degraded areas surrounding VPs on HRSI.
- Preparation of Pre-field maps for ground truthing.
UFRMP has adopted GIS and Satellite Remote Sensing for identification of degraded areas and generation of their baseline information on land use and vegetation through DGPS survey and ground truth collection.
Besides serving as a standard uniform repository for all Van Panchayat treatment areas, such data is being used for micro-planning of treatment in different identified degraded areas.
The activities include reconnaissance and delineation of treatment area followed by DGPS survey of the treatmentarea boundary, vegetation mapping of thetreatmentareausingCartosat&Resourcesatmerged satellitedata supportedwith ground-truthing,collection of sitespecific information on existing vegetation type, soil, slope,erosion status, root stock, regeneration status; finalization of site wise land use/vegetationmaps andreporting of the treatment area as per field verification and feedback from the DMU/FMU staff.
This is a valuable information for future evaluation and impact monitoring including making the Project REDD+ ready.
TREATMENT SURVEYS
The project undertakes verification of reported interventions in the field through deployment of qualified GIS and survey of experts in each DMU. A mobile utility has been developed to record data about different types of interventions such as protection fencing, water conservation measures, soil conservation measures, plantations, water harvesting structures, etc. along with their GPS co-ordinates and photographs.
Similarly, location-based data with geo-tagged images are also being collected for various assets (nursery, etc.) being created under the project. Such survey data collected from field are being integrated into Web-GIS for visualization and project monitoring.
GIS
A Satellite Land Monitoring System in form of a Web-GIS Application has been designed to integrate the Forestry Resource Geo-database to facilitate geo-data processing, data query, data analytics and generation of map-based decision support information for monitoring, evaluation and reporting of Joint Forest Management (JFM) and other forestry activities.
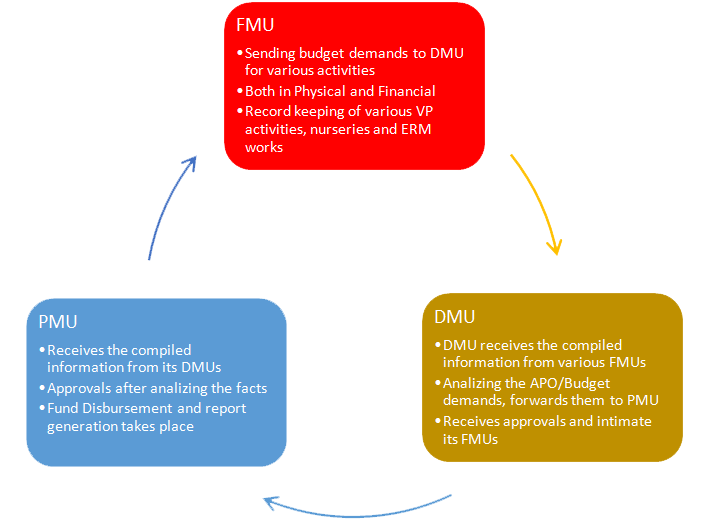
A web based MIS software has been developed by PMU named FiMS, which stands for Forest Information and Monitoring System. This MIS application captures the progress and achievements of physical and financial activities. It has been planned till Range level from where the data are integrated upwards. This data capturing process is done at Van Panchayat and SHG level using paper-based formats.
The MIS application is accessible at FMU, DMU and PMU levels.
Presently, the MIS application is capturing the data and generating reports of all three components:
1. Eco-Restoration 2. Livelihood Improvement
3. Other Support Activities
Main Functions of FiMS
- Record keeping of all the information related to the activities
- Data entry of current physical and financial activities related to Eco-restoration component.
- Document management system
- Training management system
- Profiling of Van Panchayat and Self Help Groups
- Nursery Management
- Plantation Journal
Details of SHGs and IGAs- Details of Human Resources
- Real time monitoring of project
- Real time customized reports
All the field interventions are based on comprehensive micro plans, prepared through a process of participatory planning approach. Need-based and site-specific comprehensive micro plans are being prepared at the very onset of the process through Participatory Rural Appraisal (PRA) technique.
Various community development and livelihood improvement activities that can be taken up for alleviating the sufferings of the stakeholders and for overall integrated development of the village will are also a part of micro planning process.
Interventions are to be planned and implemented by VPs, selected based on selection criteria and in clusters in micro watersheds. VPs falling in one cluster have their own site-specific comprehensive micro plans. Micro-planning process is facilitated by Forest Department (FD) and FNGO teams engaged at FMU level. In Reserve Forest (RF) areas, where it is not possible for VPs to carry out Project interventions, the works is to be executed through FD.


